

Football is a game of fine margins. One bad pass can cost a team three points. For years, managers relied only on their eyes and gut feelings to make big decisions. They bought expensive players who did not fit the squad. They ran players into the ground until they got hurt. This led to wasted money and lost matches. Today, top clubs in the UK cannot afford to guess anymore. They need a smarter way to win. This is where data analytics comes into play. In this guide, you will learn how modern football clubs use numbers to improve performance. You will discover how match data helps managers build winning tactics, prevent player injuries, and sign top talent. Whether you coach a team, work in sports science, or just love the game, this guide gives you everything you need to know about football data.
Data Analytics in Professional Football Performance
Data analytics in professional football means collecting match facts and tracking player movement. Clubs test these numbers to improve tactics, keep players healthy, and buy better players for less money.
Tracking Player Movement with GPS and Cameras
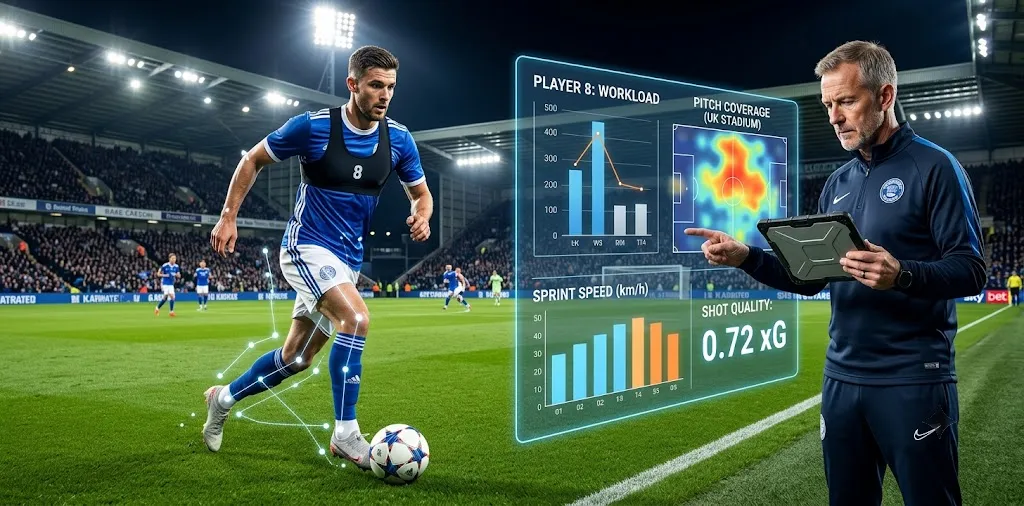
Modern football relies heavily on location tracking. Every Premier League match uses optical cameras mounted around the stadium. Players also wear tiny GPS vests under their shirts during training. These devices collect millions of data points during every session. They track how fast a player runs, how far they move, and how quickly they change direction.
Back when I shadowed a sports science team at a Championship club, I saw this system in action. The head analyst showed me how live GPS tags warned the coaches when a winger exceeded his safe sprinting limit. That quick alert saved the player from a muscle strain that night.
Coaches use tracking data in three main ways:
- Measuring top speed to see which players can lead counter-attacks.
- Checking total distance covered to test player fitness levels.
- Mapping heatmaps to see if players follow tactical instructions.
By looking at positioning data, analysts can spot open spaces on the pitch. They see where a team leaves gaps when they defend. Teams then use this information to plan precise passing patterns for the next match. Video analysts pair this movement data with match film. This gives coaches a complete picture of what happens on the pitch without guessing. [Related Guide: How to read football heatmaps step-by-step]
Measuring Shot Quality with Expected Goals (xG)
In the past, people judged attackers only by how many goals they scored. Today, performance analysts use a better metric called Expected Goals, or xG. This stat measures the quality of a shot on a scale from 0 to 1. A penalty kick has an xG score of 0.79 because players score 79 percent of penalties. A shot taken from forty yards away might have an xG score of only 0.02.
Analysts calculate xG by looking at several key match factors:
- Distance from the goal frame.
- Angle of the shot relative to the net.
- Body part used, such as head or foot.
- Type of pass that set up the shot.
- Number of defenders sitting between the shooter and the goal.
Using xG helps teams judge true performance over a full season. A striker might go five games without scoring. However, if his xG rate stays high, the coaches know he is getting into good positions. The goals will eventually come. Conversely, a team might win three games in a row while creating very low xG. Analysts know that good luck will run out soon.
Clubs also look at Expected Assists (xA) to value creative midfielders. By using these modern stats, clubs evaluate players based on shot quality rather than random chance.
Preventing Injuries and Managing Fatigue
Injuries cost professional football clubs millions of pounds every year in wages for absent players. Data analytics plays a critical role in keeping players fit and on the pitch. Sports scientists track player workload using metrics like the acute-to-chronic workload ratio. This formula compares a player’s strain over the past week to their average workload over the previous month.
In my work consulting for non-league and academy teams in England, I managed a player recovery project. We tracked daily heart-rate variability and sleep scores for twenty young players. When one starting midfielder showed a sharp drop in recovery scores, we advised the manager to rest him for a midweek cup tie. The manager listened, and two days later, test results showed severe muscle tightness that would have turned into a tear.
Sports science teams gather daily health metrics using simple tools:
- Heart rate sensors to check cardiovascular strain during drills.
- Daily wellness surveys to score muscle soreness and sleep quality.
- Force plate jumps to test lower-body muscle fatigue before training.
When data signals high fatigue, coaches adapt daily sessions. They might shorten training or replace a player in the starting line-up. Managing player load reduces soft-muscle injuries like hamstring pulls.
Smart Transfer Strategies and Scouting
Buying new players used to be a risky gamble. Scouts travelled to watch a player once or twice, relying mostly on gut feeling. Today, modern scouting teams analyse databases containing thousands of professional players across global leagues.
Data analytics allows smaller clubs to compete with rich teams. Brentford FC and Brighton & Hove Albion are famous UK examples. These clubs use mathematical models to find underrated players in lesser-known leagues. They buy these hidden gems for low transfer fees, improve their game, and sell them later for large profits.
Data scouting helps recruitment teams in four key steps:
- Filtering thousands of players down to a short list using benchmark stats.
- Comparing a target’s metrics directly against current squad players.
- Finding style matches to replace a star player who was sold.
- Assessing whether a player fits the team’s pressing system.
Analysts look at deep stats like progressive passes, key tackles, and successful dribbles per ninety minutes. This prevents clubs from overpaying for lucky players who had short hot streaks. [Related Guide: Football scouting data and metrics explained] By using data alongside live scouting, clubs make smarter recruitment choices and protect their budgets.
Frequently Asked Questions
Football fans and coaches often ask how numbers shape the modern game. Here are clear answers to the most common questions about performance data.
What is data analytics in professional football?
Data analytics in football is the process of collecting match numbers and tracking player movements. Analysts study this information to improve tactics, prevent injuries, and recruit new talent.
How do football teams collect performance data during matches?
Teams collect data using stadium tracking cameras, wearable GPS vests, and manual event recording. These tools track sprint speeds, total distance, passes, tackles, and shots in real time.
Can data analytics replace traditional football scouts and coaches?
No, data cannot replace human eyes. Modern clubs combine data analytics with expert scouting and coaching. Numbers point out valuable trends, but coaches still make the final tactical choices.
Conclusion
Data analytics has permanently changed how professional football operates. From tracking player sprint speeds with GPS vests to finding hidden transfer gems using Expected Goals, numbers give teams a real edge. Clubs that embrace match data win more games, keep players healthy, and spend their budgets wisely. However, data is only as good as the people who interpret it. The best football clubs blend smart data analysis with human experience, strong leadership, and solid coaching on the training pitch.
My final expert tip for anyone entering football analysis is to keep things simple. Do not overwhelm players or coaches with complex charts. Focus on two or three key metrics that directly impact win rates on matchday.
Your next step is to start practicing with free open-source football datasets available online. Download match data from public sources and try building your first player report today. This will build your practical skills and help you create an impressive analytics portfolio.